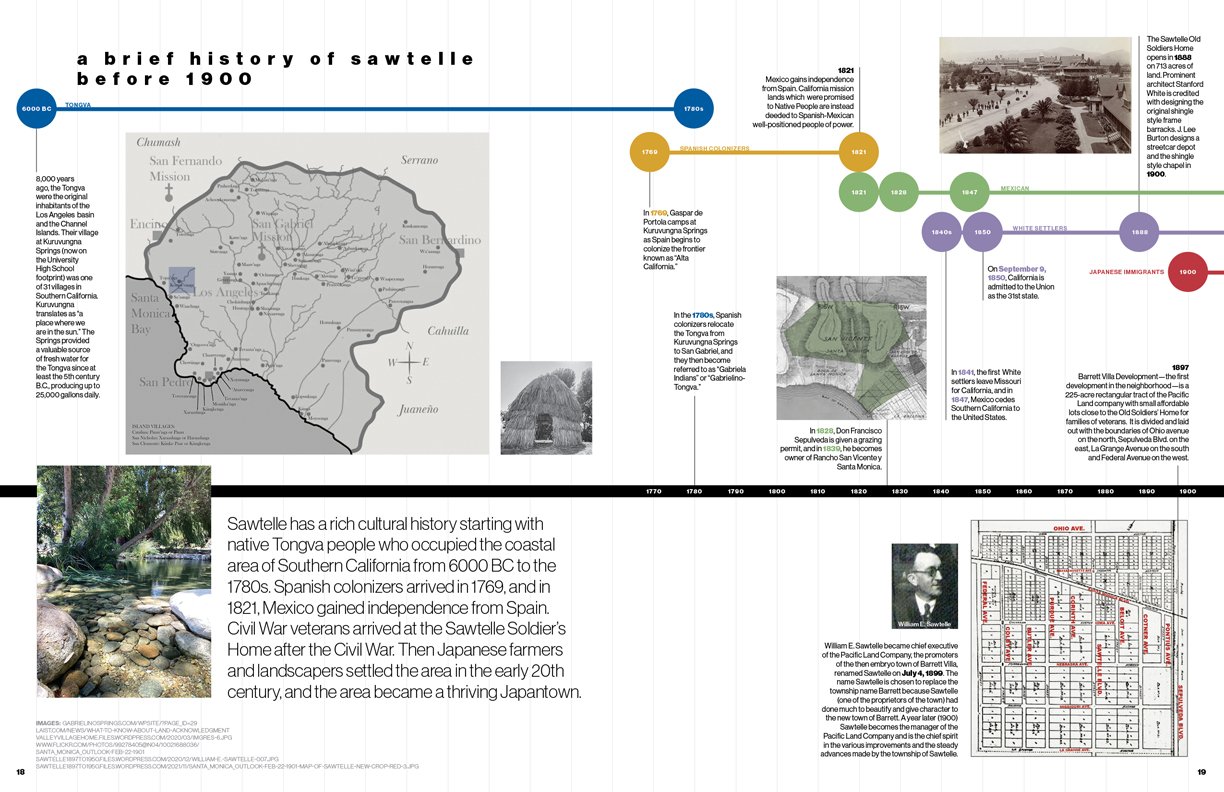
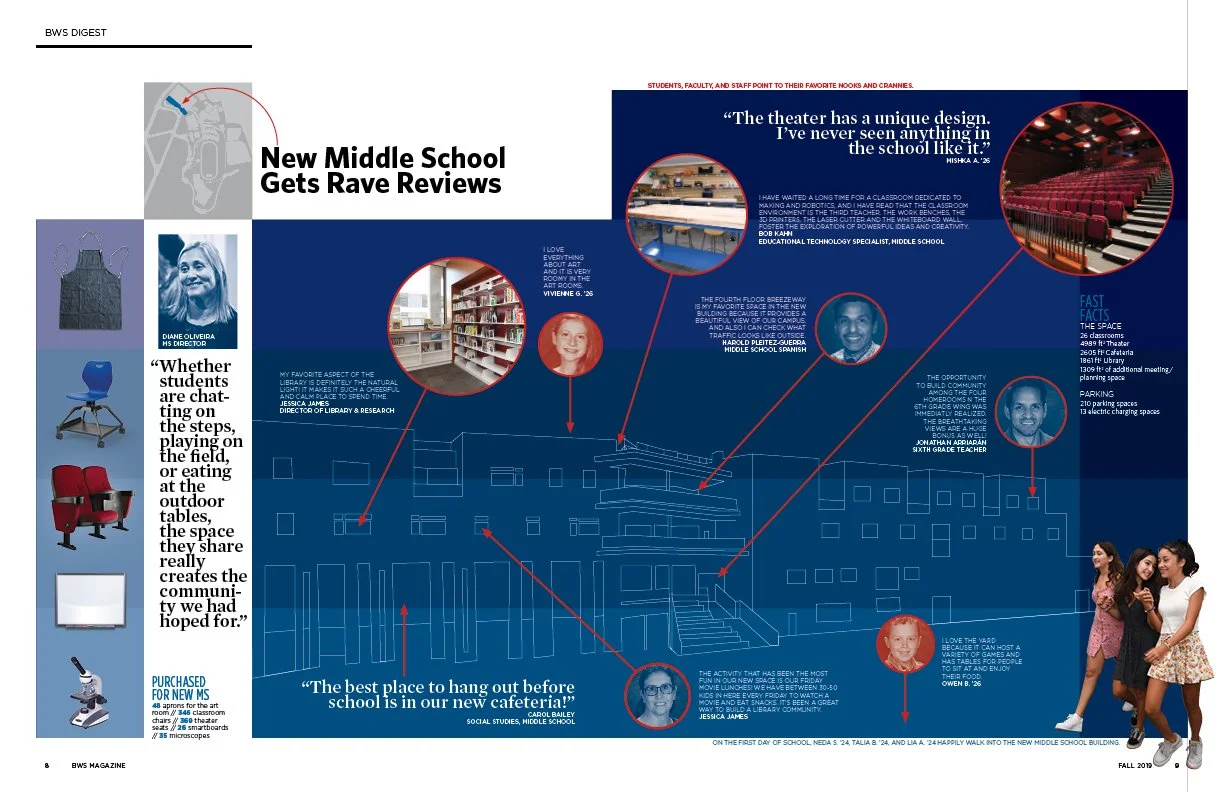
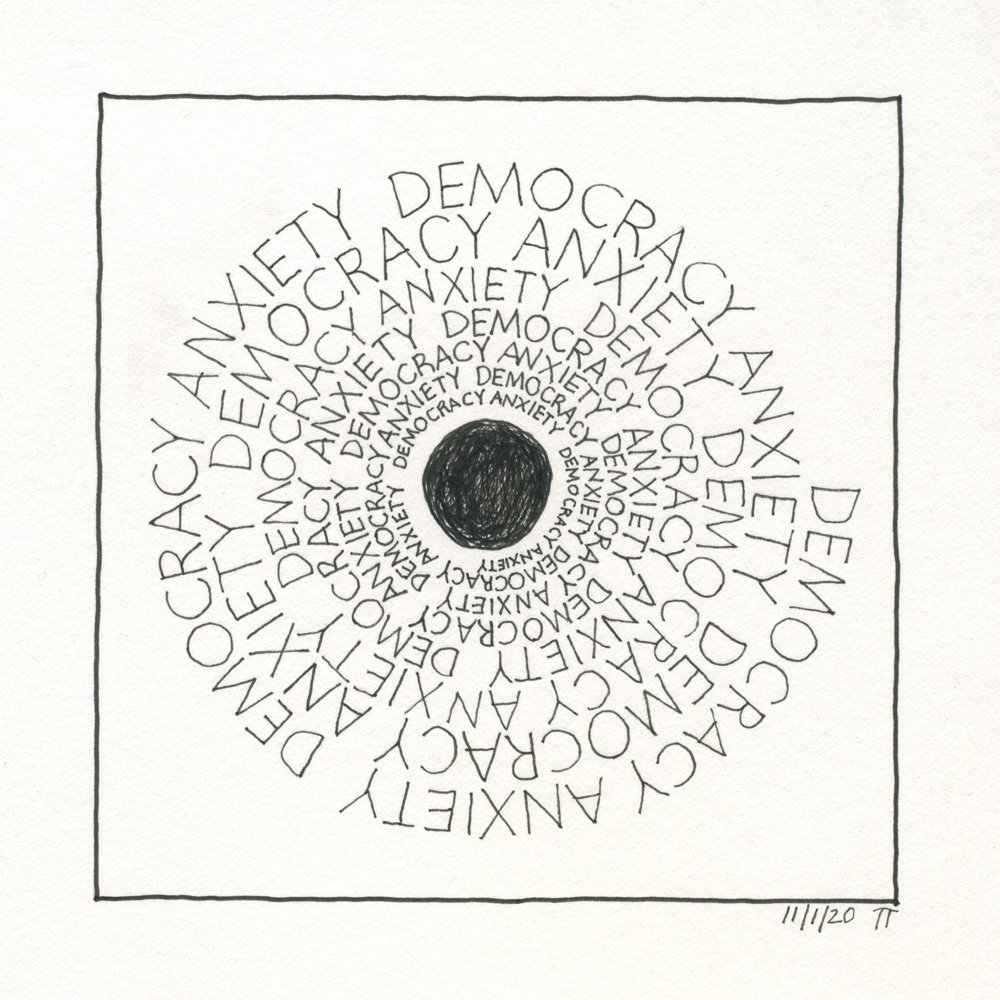
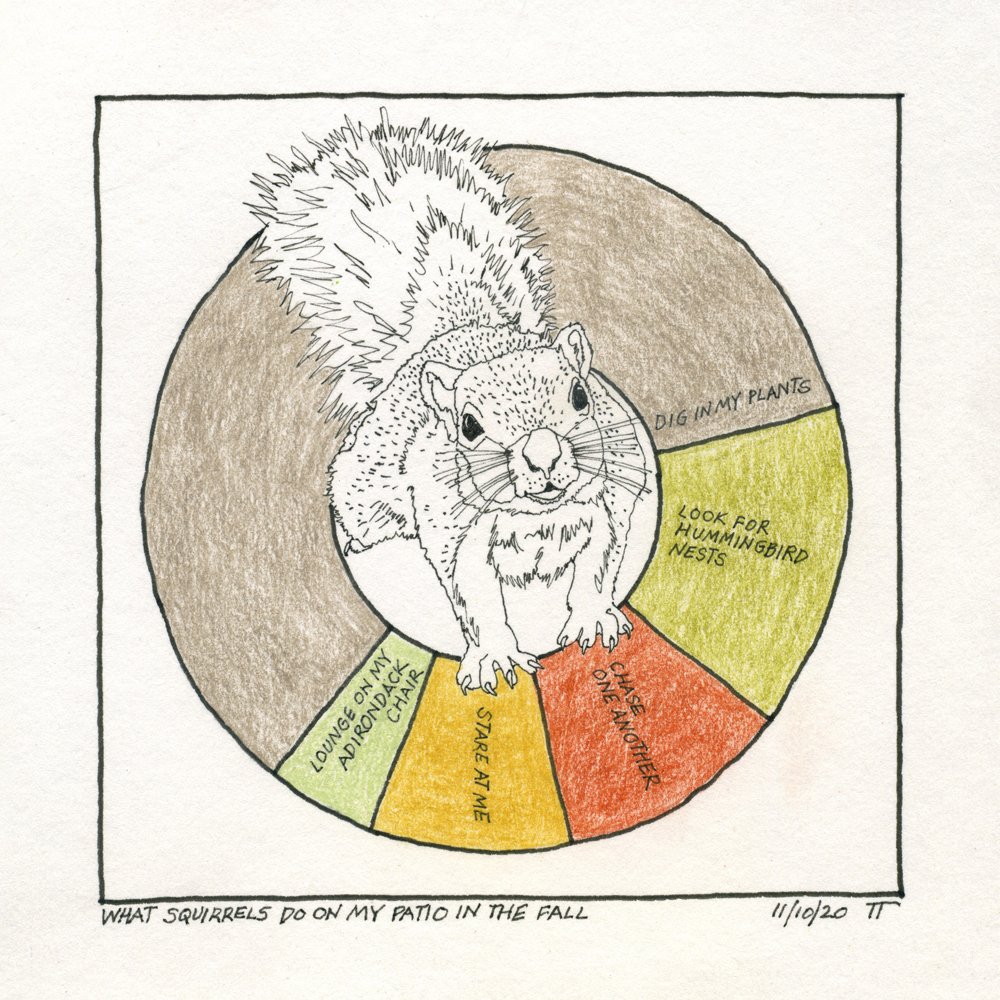
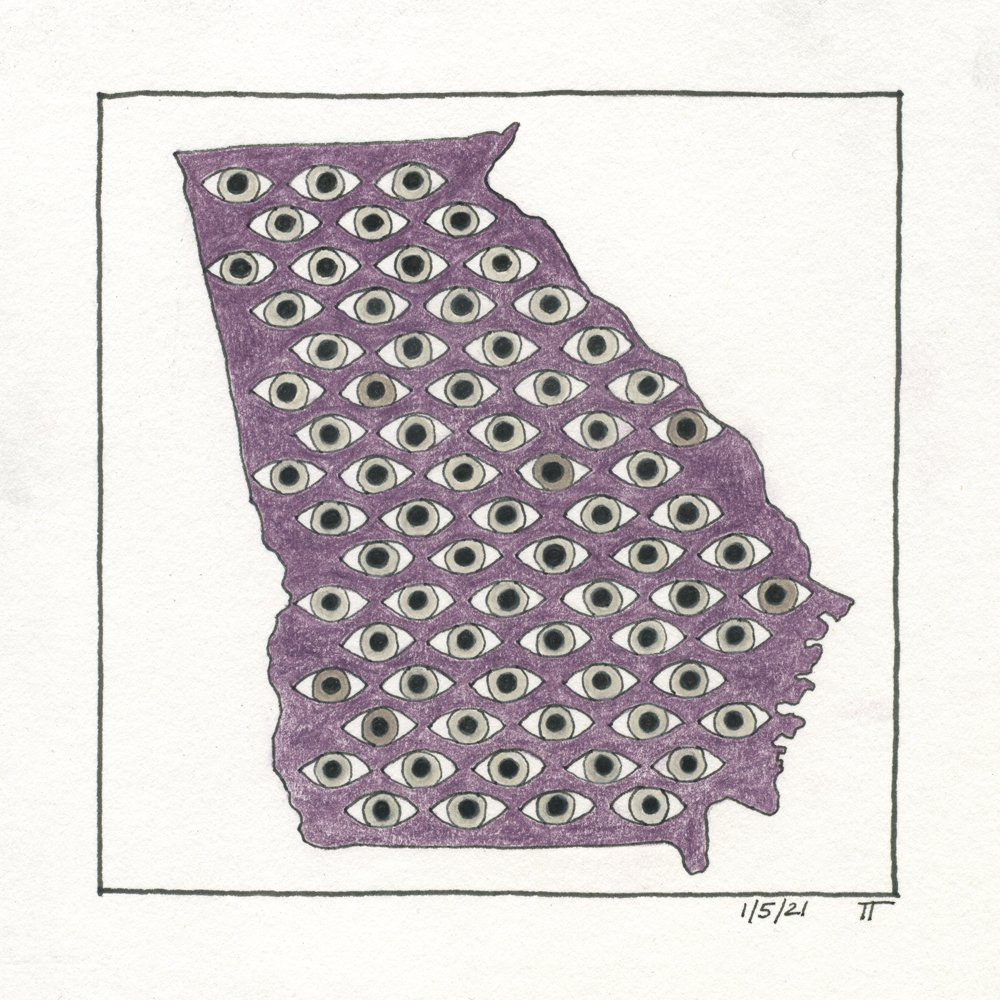
Infographics make complex information accessible. Below are graphs, charts, maps, timelines, labeled drawings, factoids, ways of representing numbers, and hand-drawn infographics.